01 / Selected work

Selected work

Projects across algorithms, geospatial interfaces, software testing, full-stack systems and embedded interaction.

01

TSP Algorithm Lab

Algorithm visualisation · Full-stack
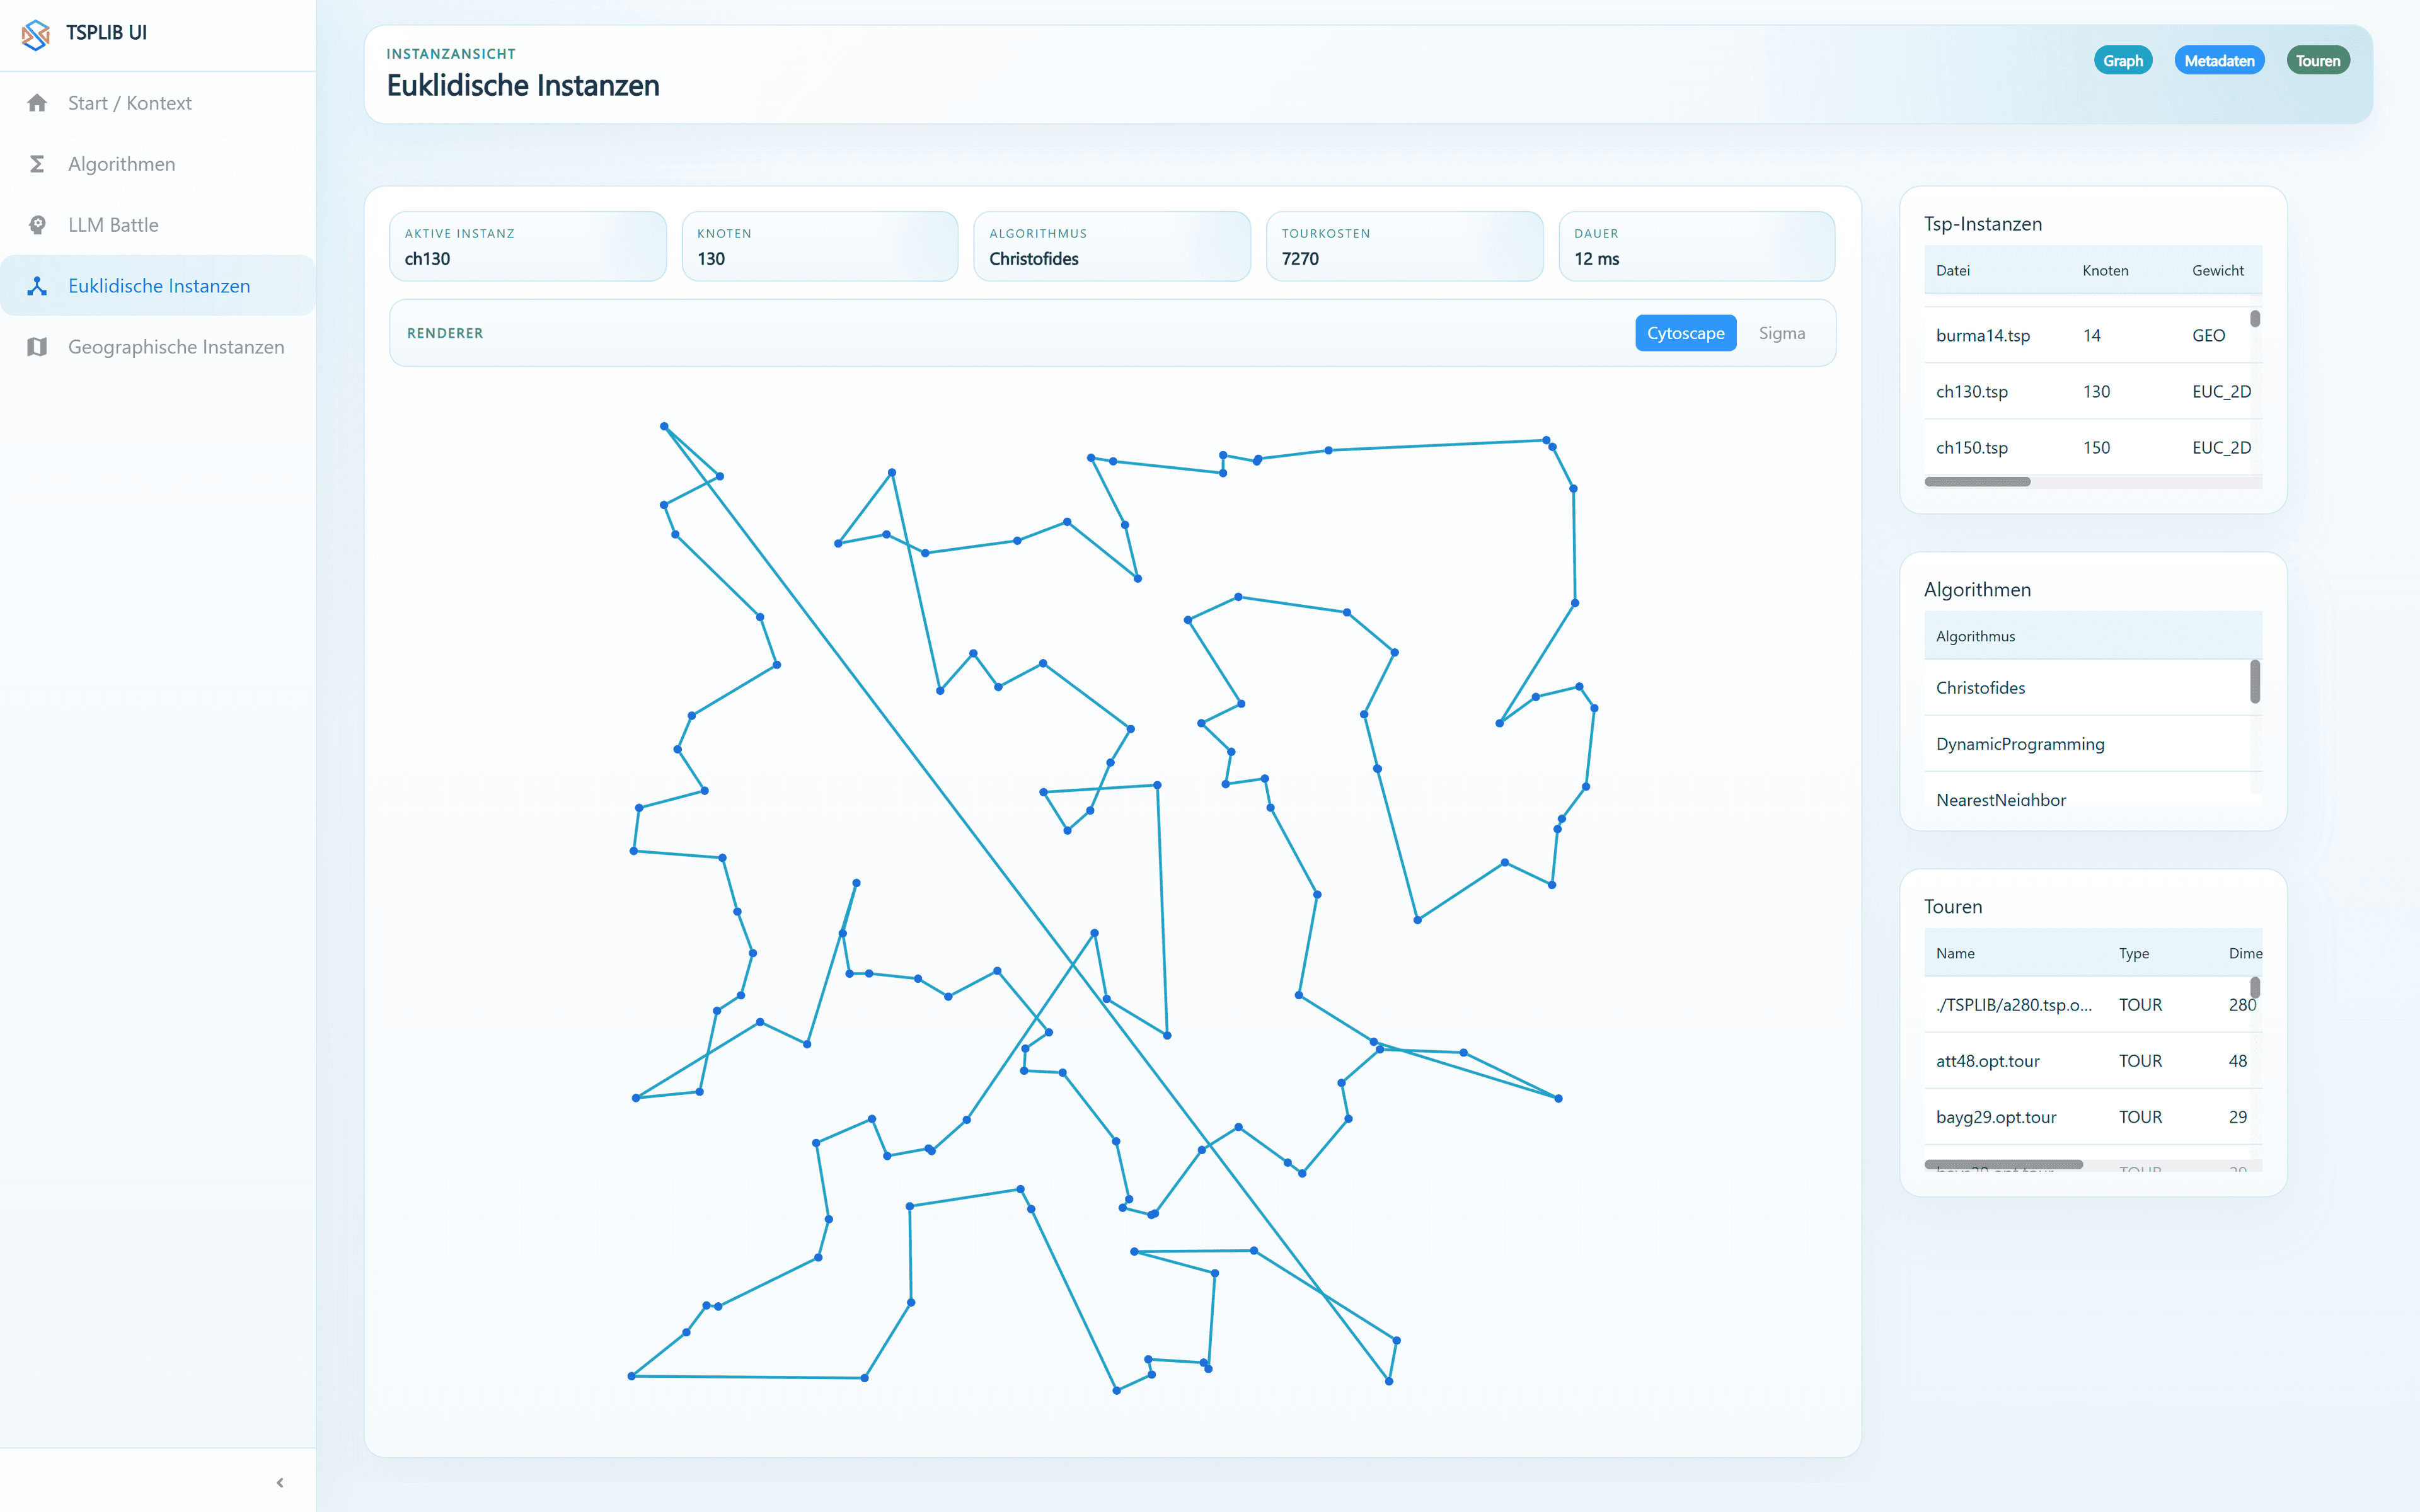
TSP Algorithm Lab: Christofides tour for the TSPLIB instance ch130 (130 nodes, tour cost 7270, 12 ms) in the euclidean graph view, alongside instance, algorithm and tour tables
Interface / route comparison

Problem

Algorithm results are difficult to compare when route quality, runtime and search behaviour are separated across different tools.

What I built

A React and TypeScript interface with a Java and Spring Boot backend that parses TSPLIB instances and compares multiple TSP approaches through graph and map views.

Decision note

Keep the dataset constant while changing the algorithm, so differences in route quality and runtime remain visible.

What I learned

Heuristic behaviour becomes easier to explain when the search process is visual, not only numerical.
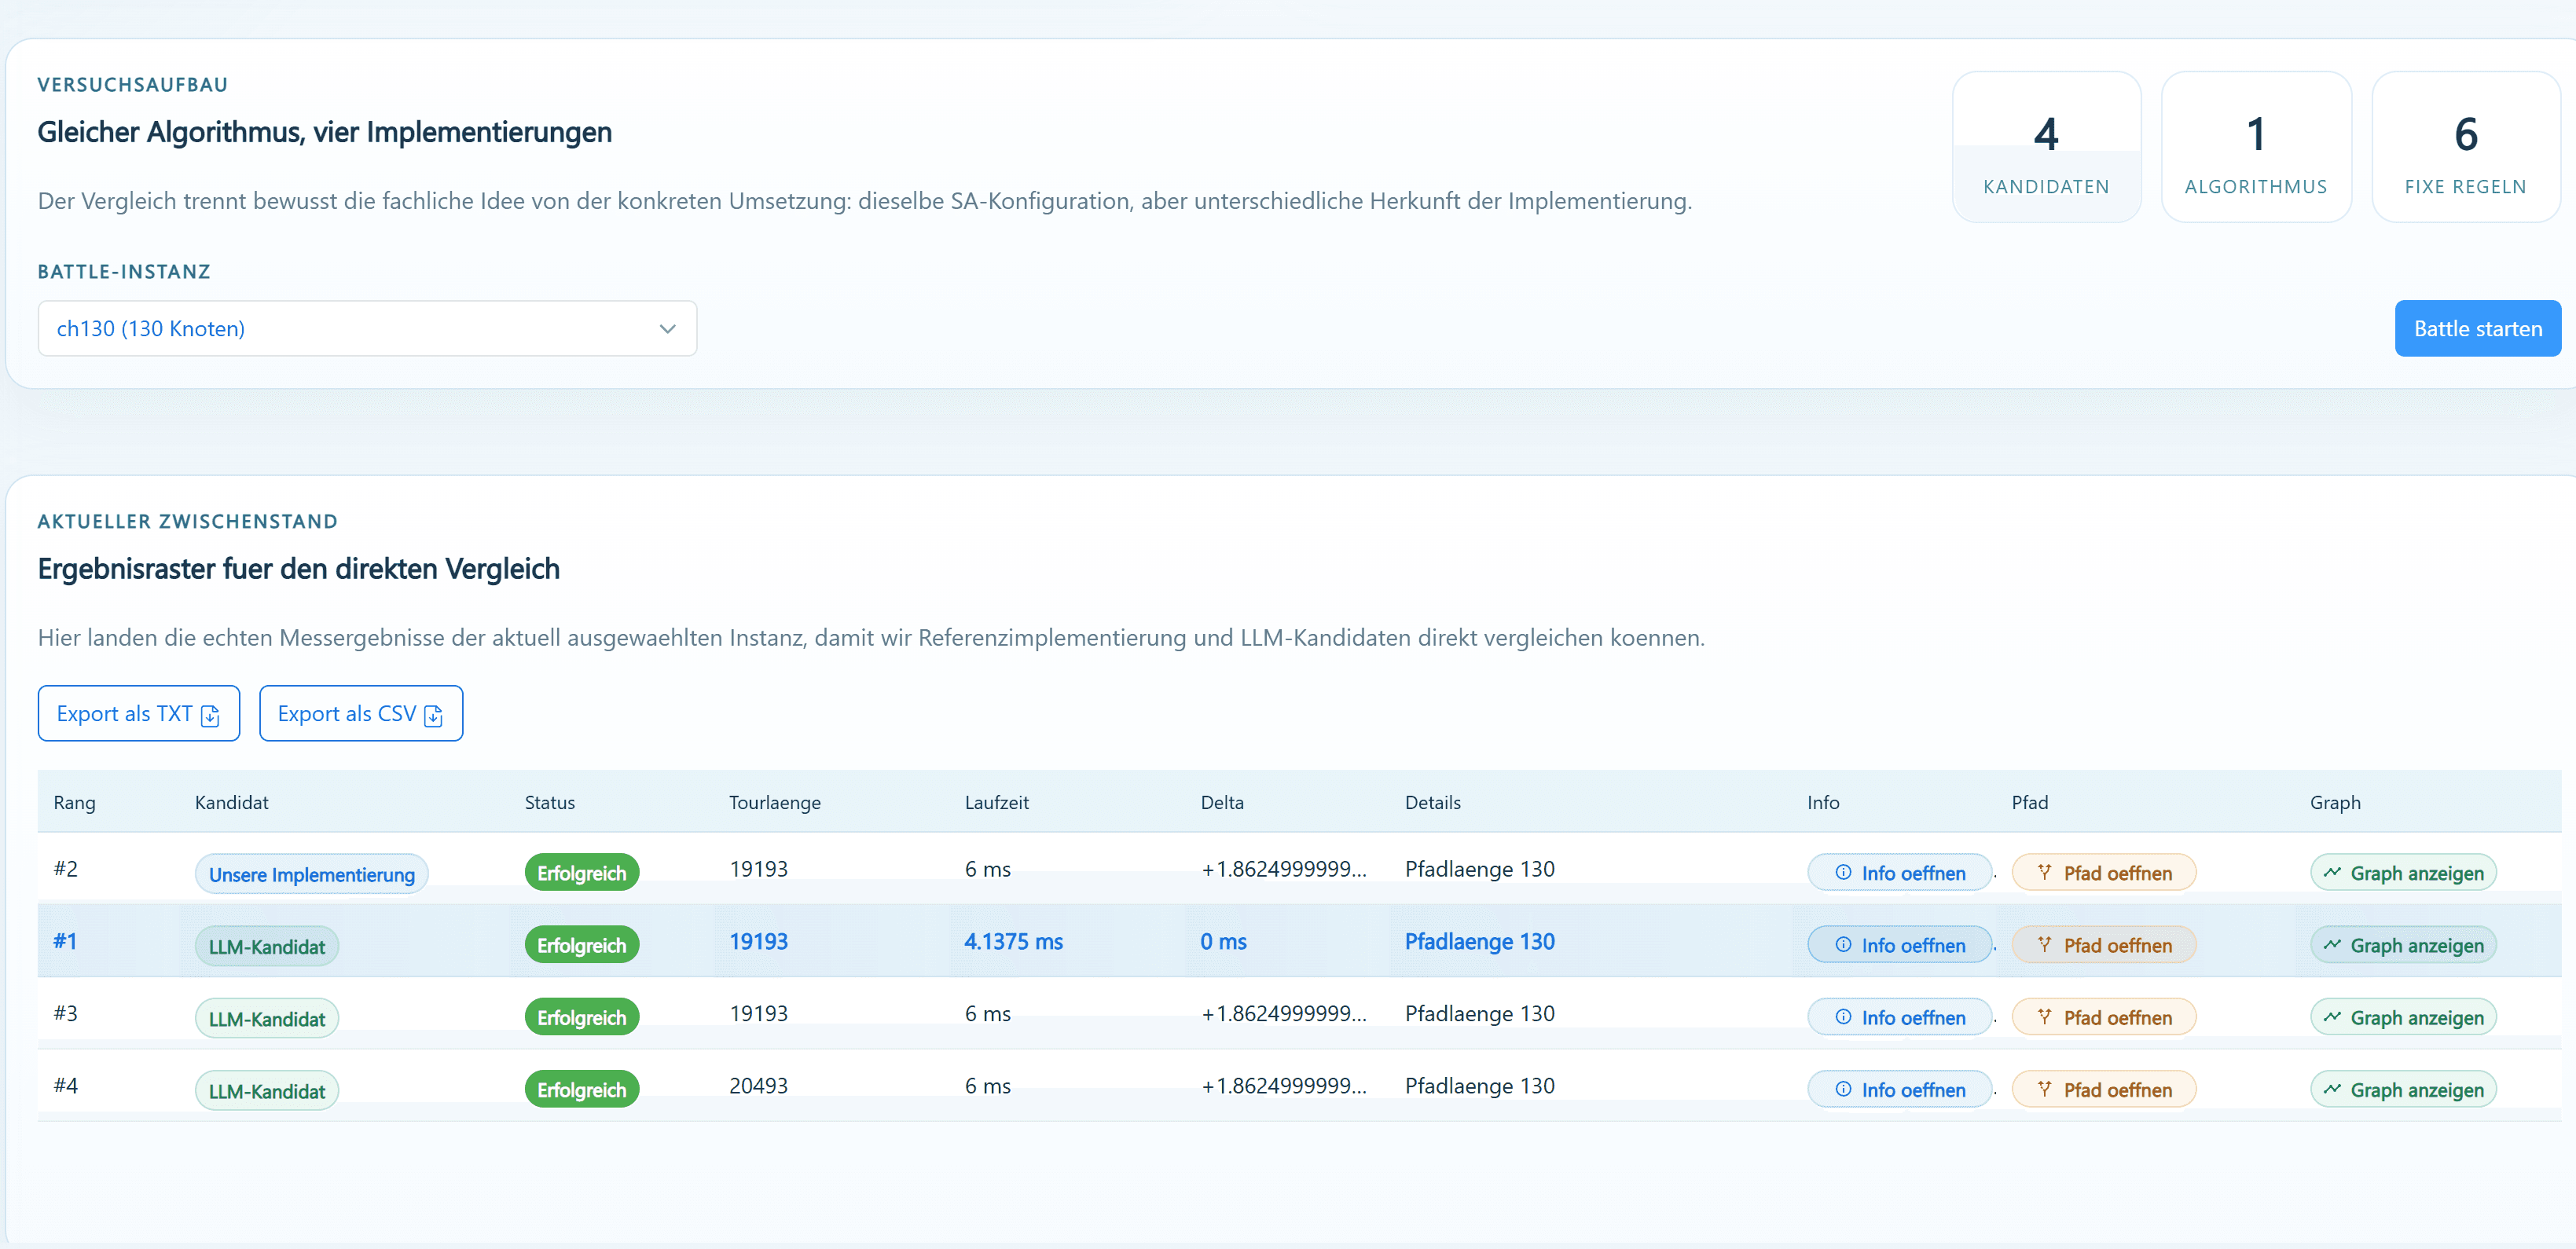
TSP Algorithm Lab: ranked comparison of four Simulated Annealing implementations on ch130, listing tour length, runtime and delta for each candidate
Simulated Annealing comparison
ReactTypeScriptJavaSpring BootTSPLIBAlgorithms

View repository

02

Biodiversity Warehouse

Geospatial data · Frontend

Problem

Large biodiversity datasets are difficult to explore when records, species filters and geographic context are separated.

What I built

An interactive geospatial interface that combines species filtering, UTM-based views, clustered records and multiple map layers.

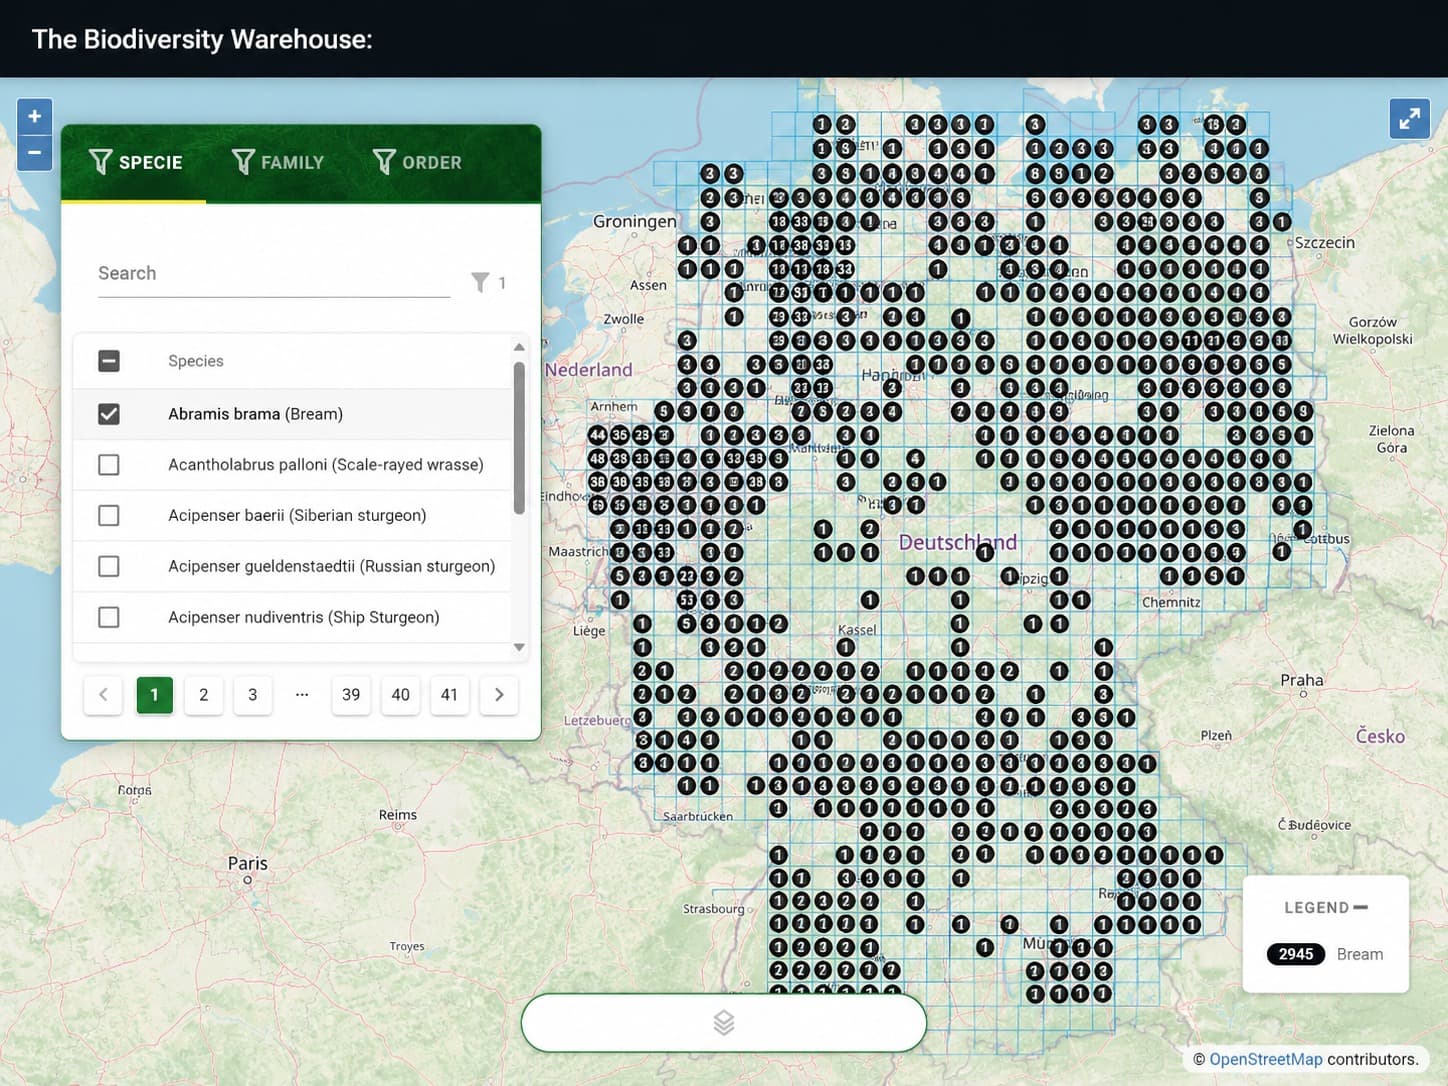
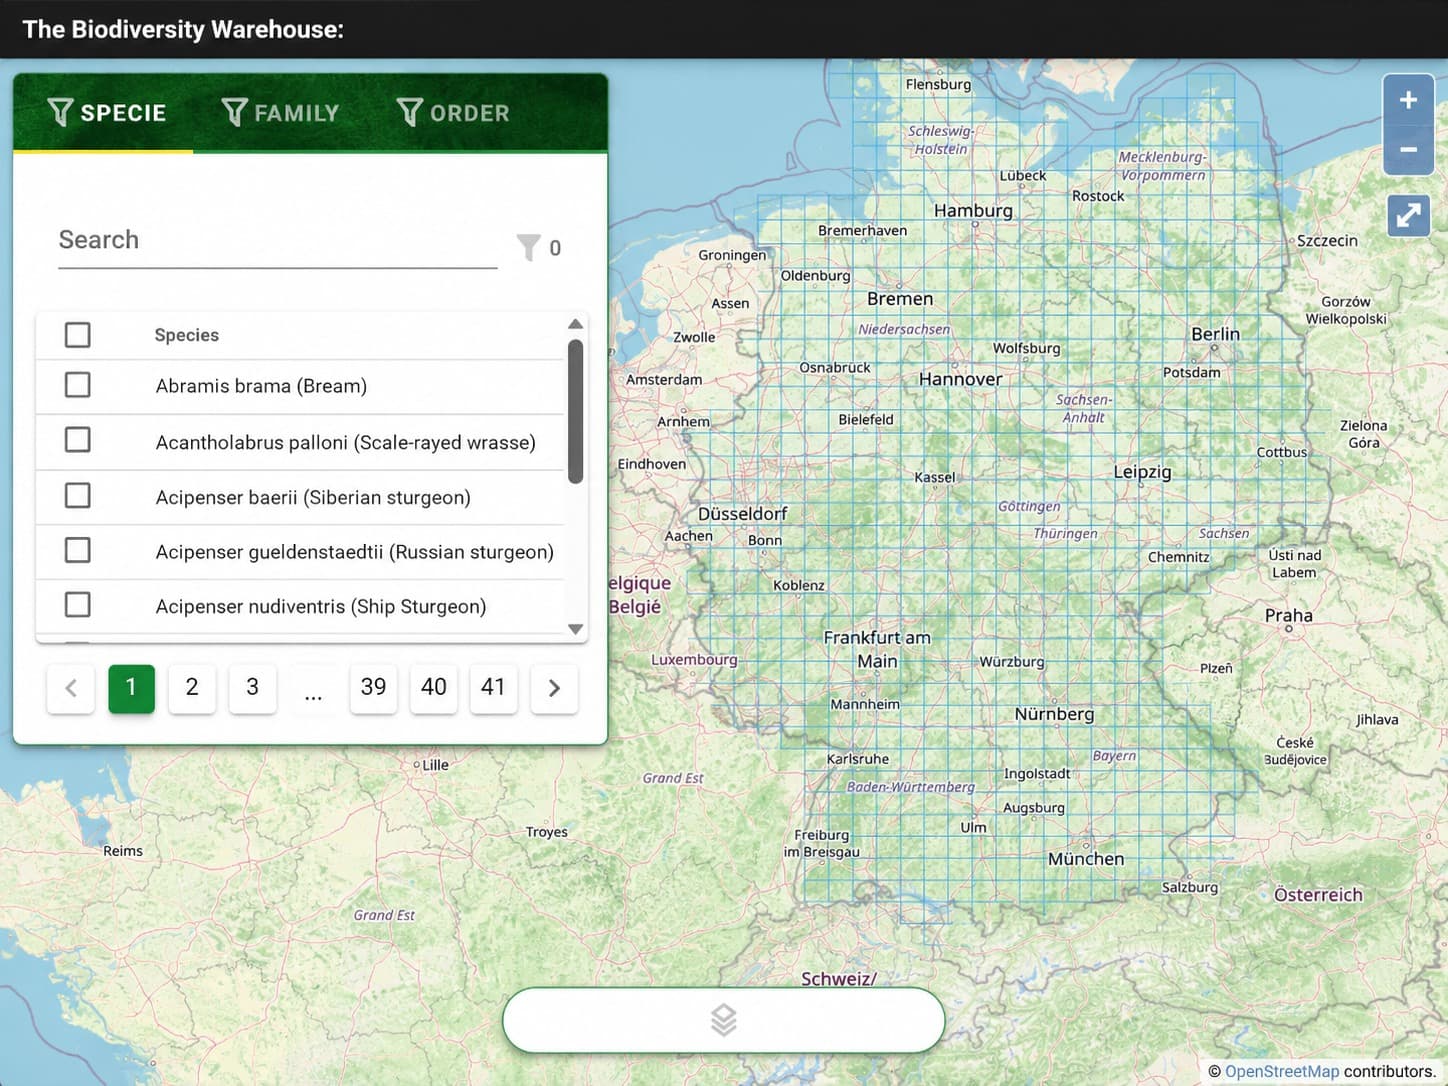
Biodiversity Warehouse: species, family and order filter panel over the interactive UTM grid map of Germany
Species filters and UTM grid

Decision note

Show different information densities at different map scales instead of forcing every record into one view.

Biodiversity Warehouse: clustered species records over a UTM grid of Germany, with an active species filter and a live legend
Filtered records / clustered distribution

What I learned

Geospatial interfaces become clearer when filters, aggregation and zoom level work together.

VueTypeScriptOpenLayersUTM

View project

03

EV Charging Infrastructure

Geospatial · Data

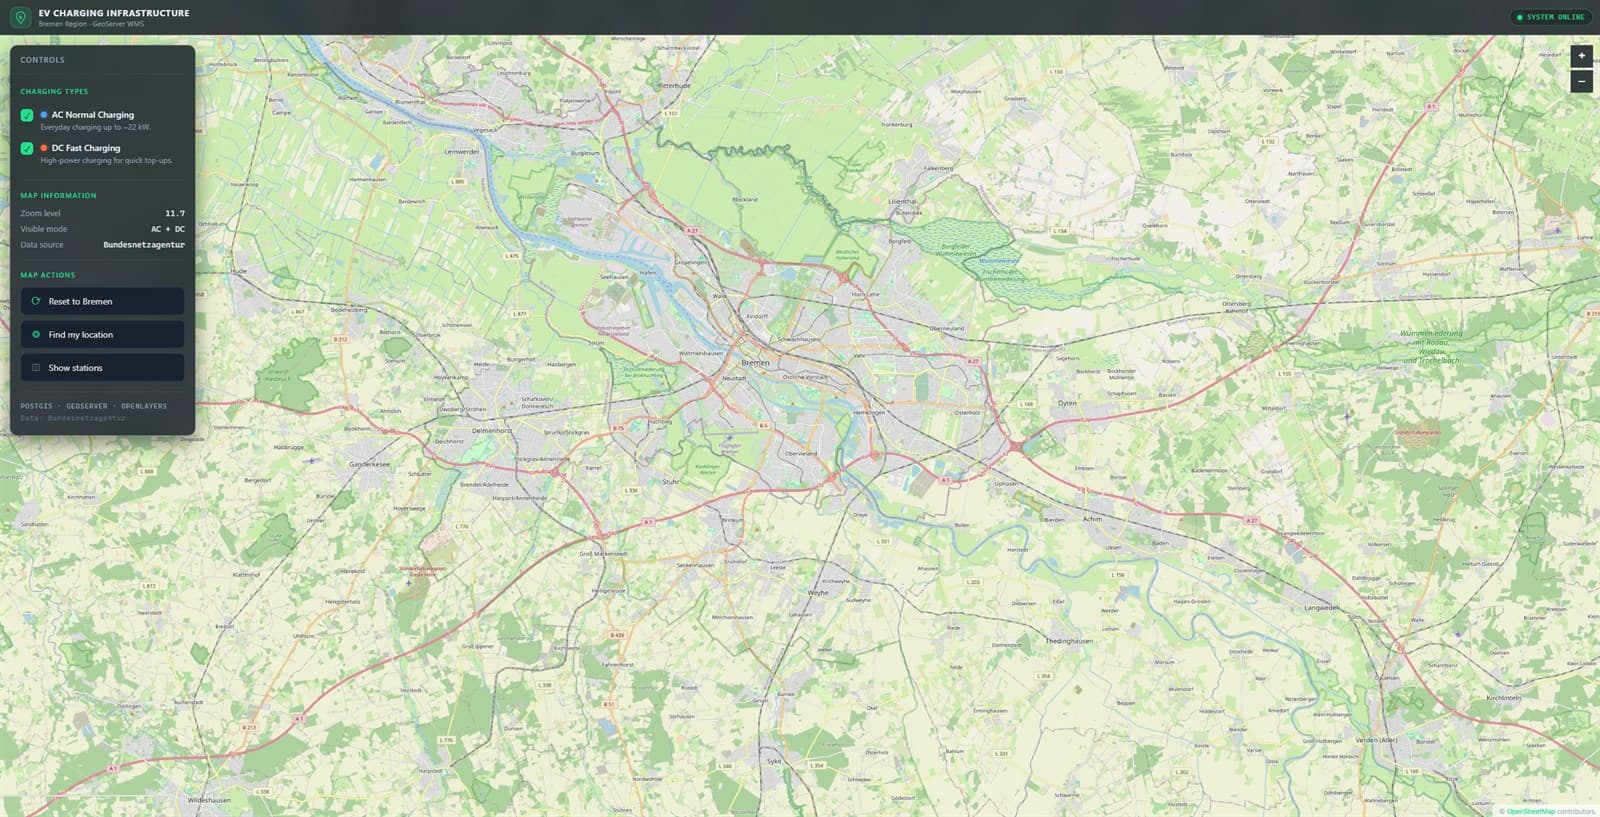
EV Charging Infrastructure: WebGIS overview of the Bremen region with charging-type controls and map information
Region overview
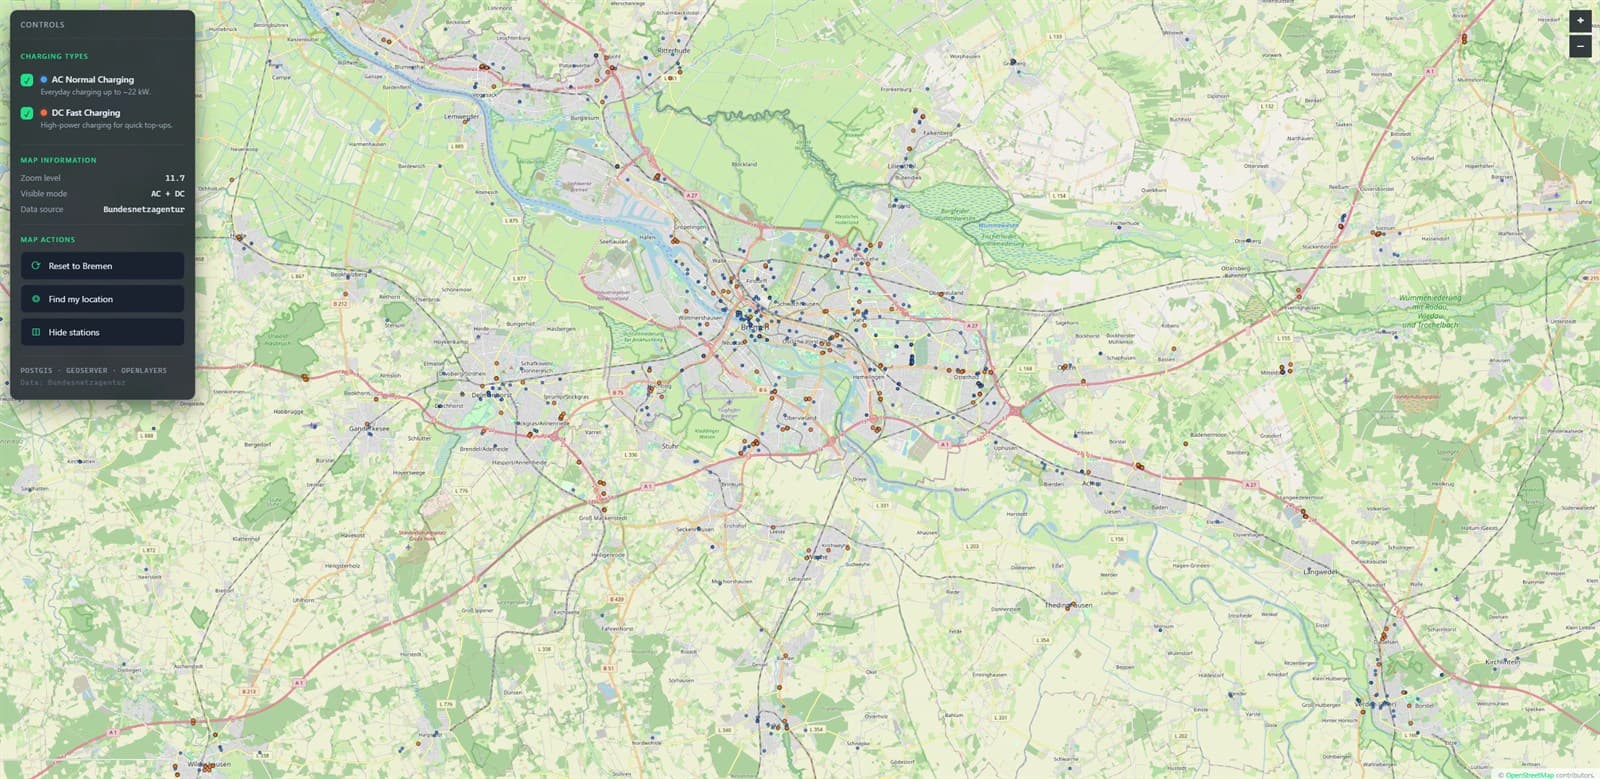
EV Charging Infrastructure: AC and DC charging stations plotted across the Bremen region via GeoServer WMS
AC and DC stations
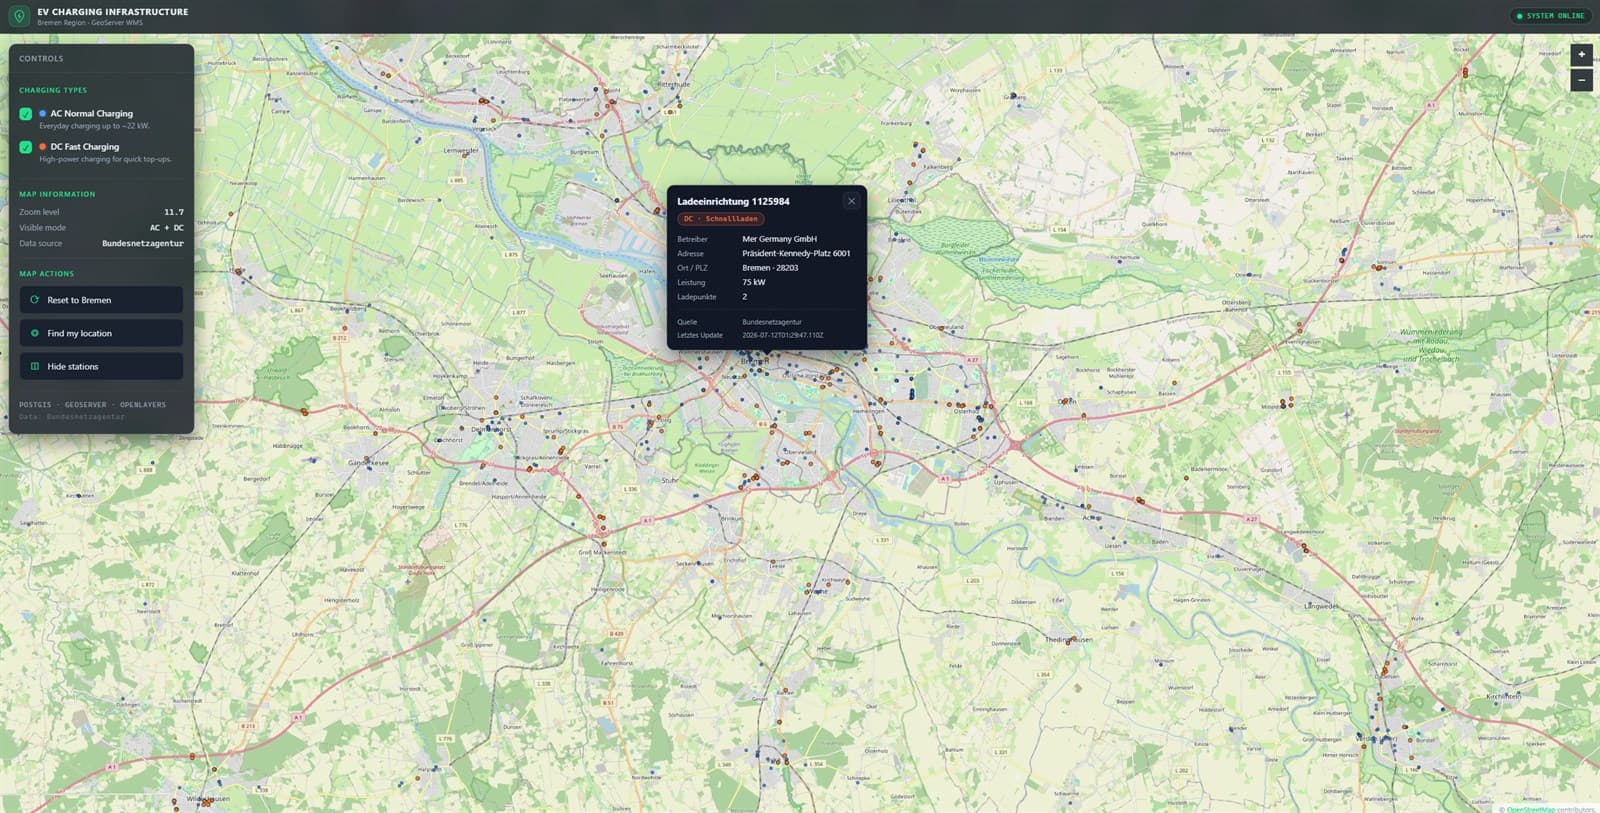
EV Charging Infrastructure: station detail popup with operator, address, power and charging points
Station detail

A containerised WebGIS platform that visualises 104,117 German EV charging-station records through PostgreSQL and PostGIS, GeoServer WMS/WFS services, and an interactive OpenLayers interface.

Challenge

104,117 charging-point records stay usable because PostGIS and GeoServer WMS serve only what the current map view needs.

Takeaway

Let the database and the map server do the heavy lifting — the client should only ask, not compute.

PostGISGeoServerOpenLayersDocker

View repository

04

Escape Room Puzzle System

Physical computing

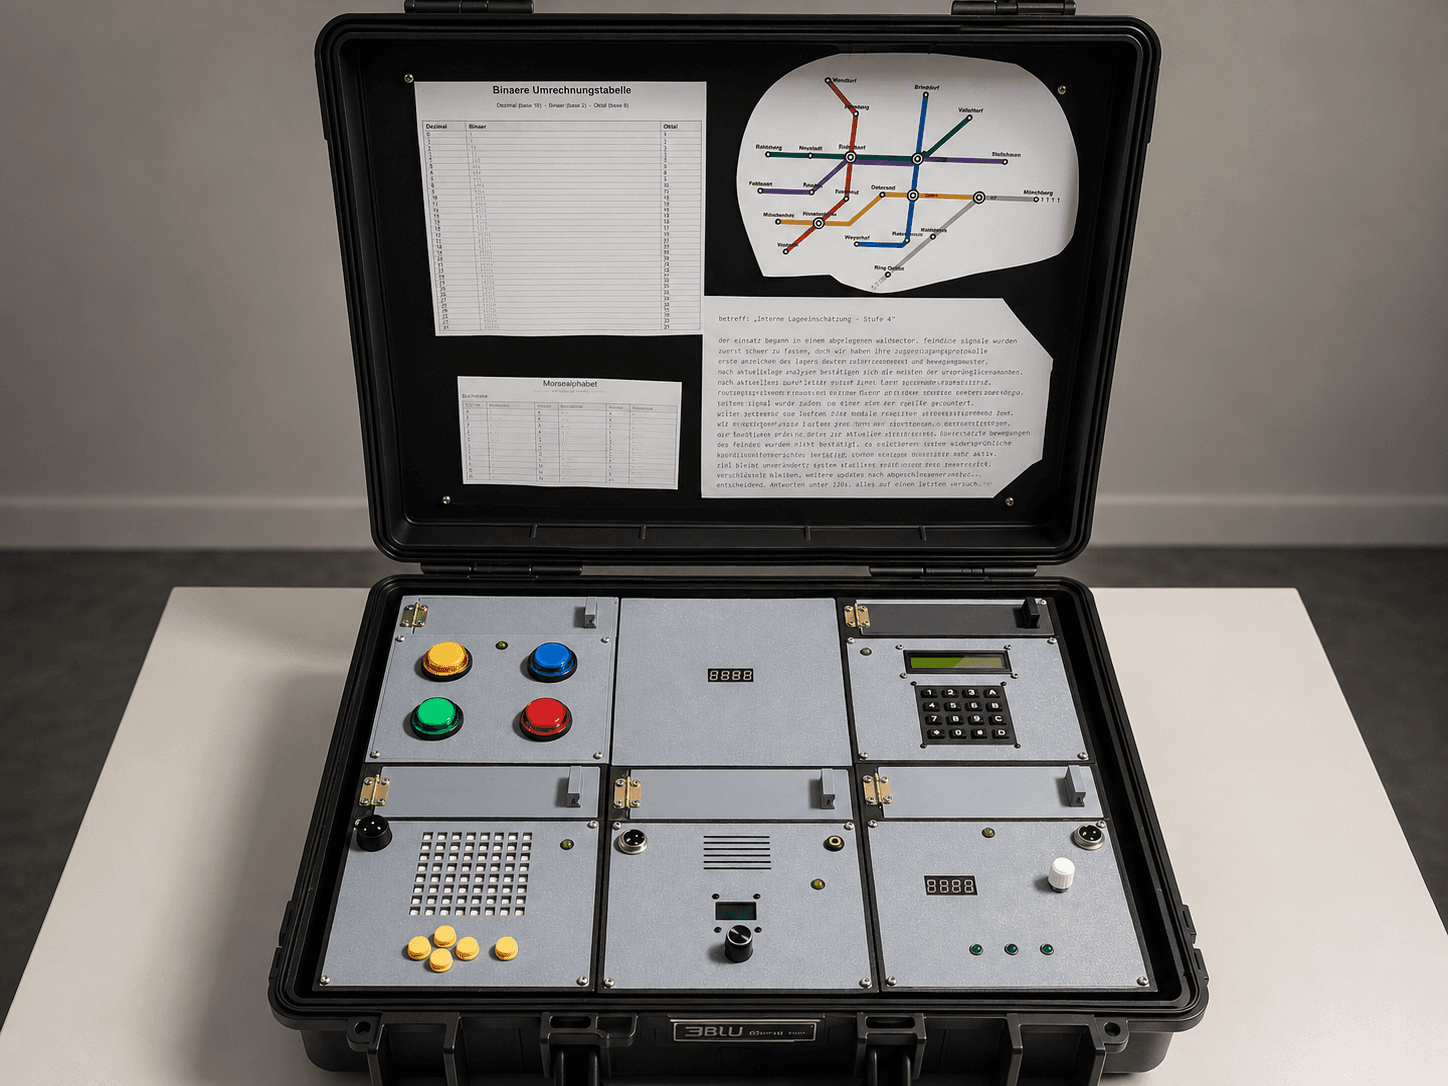
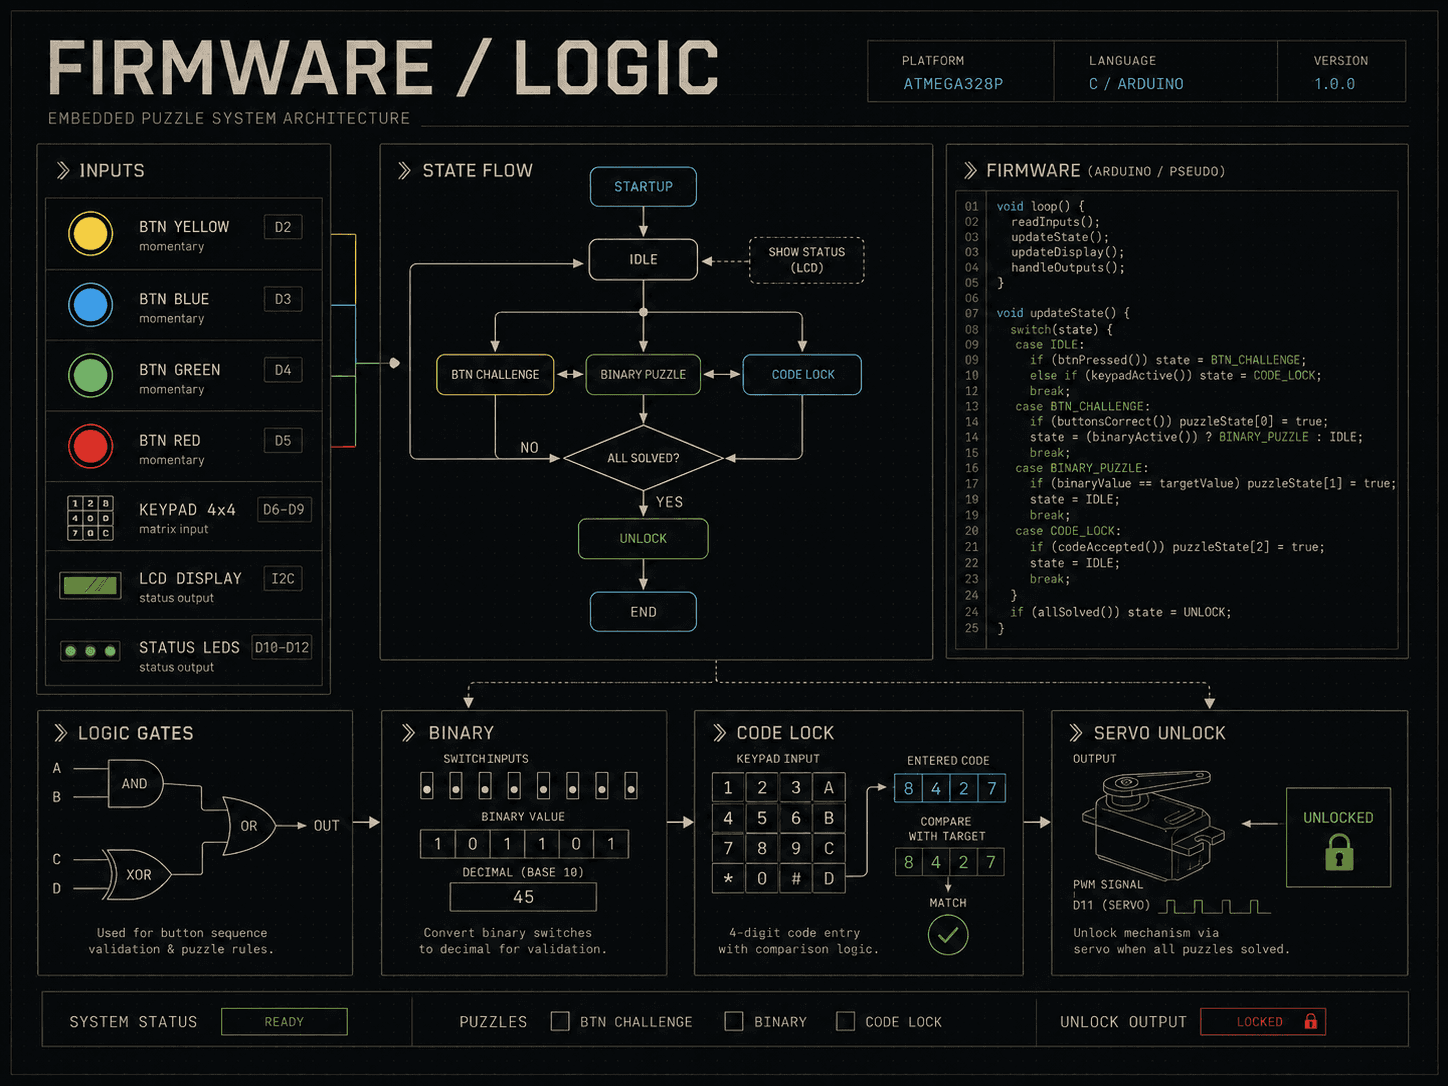
Physical input → puzzle logic → validation → servo unlock

Finished physical escape-room puzzle system with buttons, keypad, displays and modular controls
Finished puzzle system
Firmware and logic overview of the escape-room puzzle system
Firmware / logic diagram

A modular Arduino puzzle system developed as part of an escape-room course project, featuring logic-gate, binary-conversion and code-entry challenges with LCD, servo, button and progression-control integration. The public repository contains sanitised material related to my own contributions.

Challenge

Keeping chained puzzles deterministic: buttons, keypad and displays talk over I2C, and progression only advances when wiring and firmware agree.

Takeaway

Debugging changes when state lives in hardware — the fault can sit in the circuit, in the code or in the connection between them.

ArduinoC++I2CElectronics

View repository

05

Spor Toto Test Automation

End-to-end testing · Software quality

Test strategy

The tests treat the application as a user would: entering through the interface, verifying protected behaviour and checking that critical flows remain stable across viewport sizes.

Risk map

  1. 01Authentication
  2. 02Protected routes
  3. 03Session handling
  4. 04Responsive layouts
  5. 05Regression confidence

Evidence

tests/route-protection.spec.ts
test("anonymous access to /admin redirects to the login page", async ({ page }) => {
  const admin = new AdminPage(page);
  await admin.goto();
  await expect(page).toHaveURL(/\/giris\?next=%2Fadmin/);
});

A real check from the suite: an anonymous visit to /admin must land on the login page with the original destination preserved — spoofed client-side session values included.

  • 3 spec files · 9 scenarios · 15 cases per browser project
  • Chromium · Firefox · WebKit · Mobile Chromium (Pixel 7)
  • GitHub Actions workflow: playwright.yml

What it protects

The suite protects authentication boundaries, navigation rules and critical user flows from silent regressions.

What I learned

End-to-end tests are most useful when they are tied to product risks, not only UI elements.

PlaywrightTypeScriptCI/CDPOM

View repository

06

Fokur Toto Ligi

Product · Full-stack

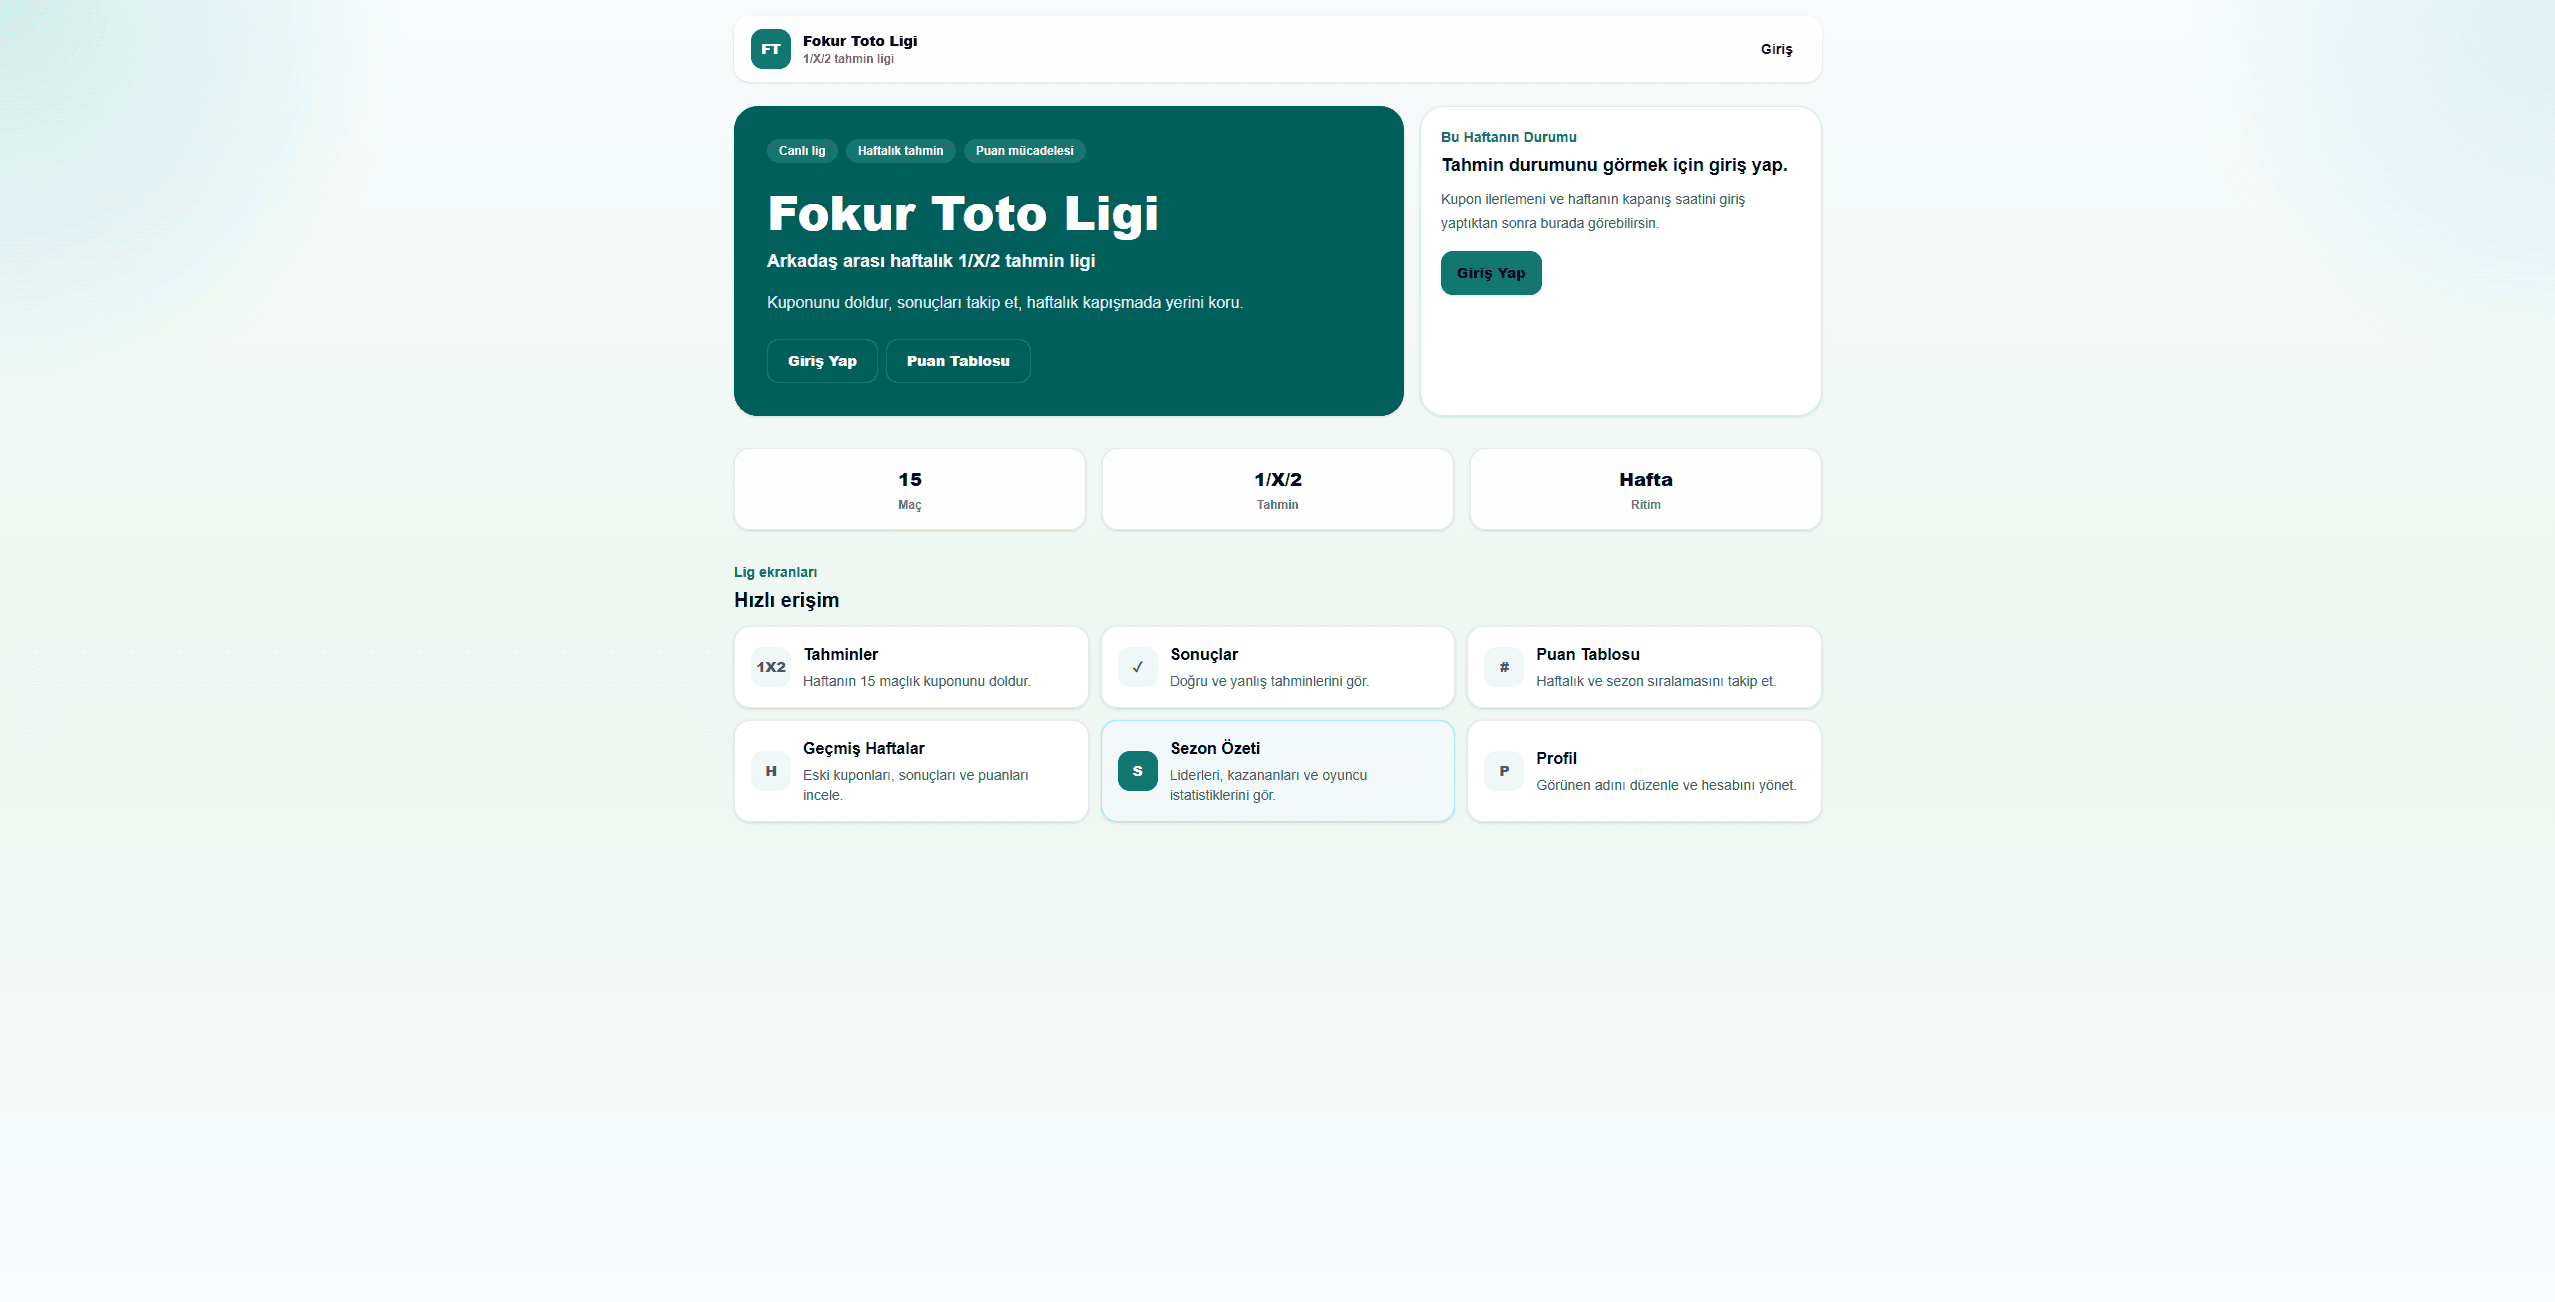
Fokur Toto Ligi: home screen of the weekly 1/X/2 football prediction league with quick access to predictions, results and leaderboard
Home screen

An invite-only football prediction platform with weekly 1/X/2 picks, prediction deadlines, automated scoring, leaderboards, weekly results and player history.

Challenge

Weekly rounds live and die by trust: deadlines, automated scoring and rankings have to be reproducible from the stored predictions.

Takeaway

In a small league product, transparent scoring matters more than any additional feature.

Next.jsReactTypeScriptSupabasePostgreSQL

View repository

07

Burada — Android Attendance App

Early project · Android

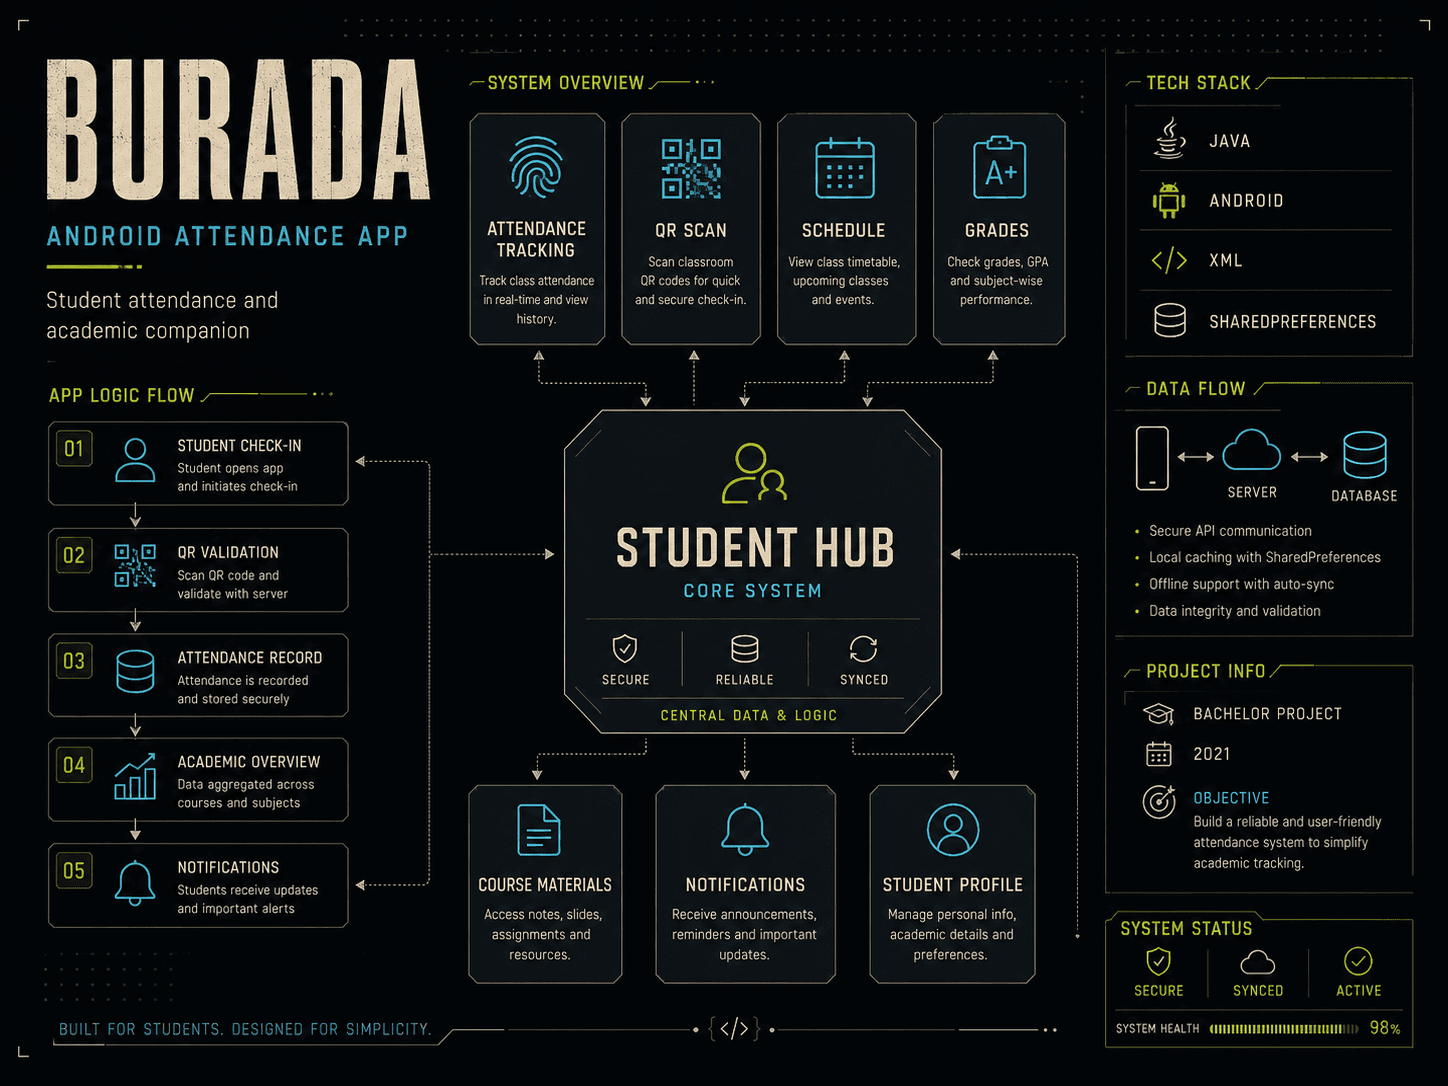
System overview diagram of the Burada Android attendance and student-information application
System overview (diagram)

My first substantial Android application and bachelor's graduation project from 2021: a Java-based attendance and student-information prototype with QR scanning, schedules, grades, course materials and notifications. Preserved as a historical milestone in my development journey.

Challenge

Attendance, schedules, grades and notifications as one solo Java and XML project — with application state kept in SharedPreferences.

Takeaway

What I would approach differently today: clearer separation of data, UI and platform responsibilities.

AndroidJavaXMLSharedPreferences

View repository